The project consists of ten iterations, and the number of story points remaining throughout the first six iterations was
- Iteration 1 – 100
- Iteration 2 – 80
- Iteration 3 – 55
- Iteration 4 – 65
- Iteration 5 – 50
- Iteration 6 – 45
| Iteration 1 | Iteration 2 | Iteration 3 | Iteration 4 | Iteration 5 | Iteration 6 | |
|---|---|---|---|---|---|---|
| Progress | 100 | 80 | 55 | 65 | 50 | 45 |
| Scope change | 0 | 0 | 15 points added | 10 points added | 25 points added | 0 |
In chart A, the bar for iteration 1 extends from zero to 100 points, and the bar for iteration 2 extends from zero to 80 points. The bar for iteration 3 extends from -15 to 55 points. The bar for iteration 4 extends from -10 to 65 points. The bar for iteration 5 extends from -25 to 50, and the bar for iteration 6 extends from 0 to 45.
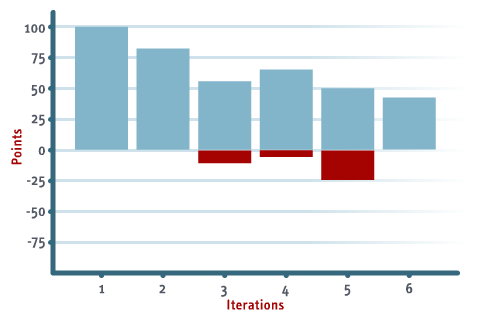
Chart A
In chart B, the bar for iteration 1 extends from zero to 100 points, the bar for iteration 2 extends from zero to 80 points, and the bar for iteration 3 extends from zero to 55 points, with 15 points highlighted in red. The bar for iteration 4 extends from zero to 50 points, with 10 points highlighted in red. For iteration 5, the bar extends from zero to 50, and 25 points have been indicated in red. For iteration 6, the bar extends from zero to 45.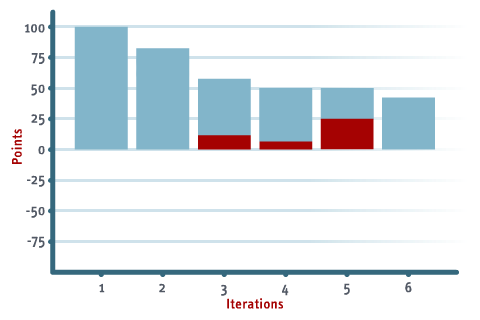
Chart B
In chart C, the bar for iteration 1 runs from zero to 100 points and the bar for iteration 2 runs from zero to 80 points. The bar for iteration 3 extends from -55 to 15 points, with 15 points indicated in red above the X-axis. For iteration 4, the bar extends from -65 to 10 points, and 10 points are highlighted in red above the X-axis. For iteration 5, the bar extends from -50 to 25, and 25 points are highlighted in red above the X-axis. The bar for iteration 6 extends from zero to 45.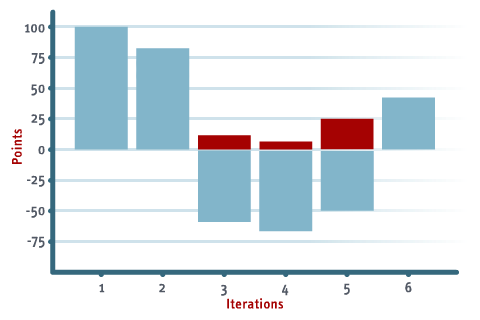
Chart C
Hiç yorum yok:
Yorum Gönder