You can develop a burndown chart
using data from the iteration backlog, which is constantly updated.
|
Updates of work remaining at the end of each day in an iteration
|
|||||||||
|
Product backlog item
|
Task
|
Team member
|
Initial estimate of effort
|
Effort remaining after day 1
|
Effort remaining after day 2
|
Effort remaining after day 3
|
Effort remaining after day 4
|
Effort remaining after day 5
|
Effort remaining after day 6
|
|
As a client, I want to transfer money into my account
|
Edit database
|
Jonathan
|
6
|
5
|
4
|
1
|
0
|
0
|
0
|
|
As a client, I want to transfer money into my account
|
Develop web site
|
Jennifer
|
4
|
4
|
4
|
3
|
0
|
0
|
0
|
|
As a client, I want to transfer money into my account
|
Create backend business logic
|
Neil and Sally
|
3
|
3
|
3
|
3
|
1
|
0
|
0
|
|
As a client, I want to transfer money into my account
|
Perform testing
|
Simon and Peggy
|
4
|
5
|
5
|
5
|
4
|
0
|
0
|
|
As a client, I want to transfer money into my account
|
Update help information
|
Jennifer
|
2
|
2
|
2
|
2
|
2
|
0
|
0
|
|
As a client, I want to check my account balance
|
Modify database
|
Jonathan
|
6
|
6
|
6
|
6
|
6
|
6
|
4
|
|
As a client, I want to check my account balance
|
Develop web page
|
Sally
|
4
|
4
|
7
|
7
|
7
|
7
|
5
|
|
As a client, I want to check my account balance
|
Develop business logic
|
Peggy
|
5
|
5
|
5
|
5
|
5
|
5
|
3
|
|
As a client, I want to search for services and products.
|
Create database
|
Jonathan
|
6
|
5
|
4
|
4
|
3
|
3
|
2
|
|
As a client, I want to search for services and products. As a client, I
want to search for services and products.
|
Develop web page
|
Jennifer
|
5
|
5
|
4
|
4
|
3
|
2
|
1
|
|
As a client, I want to search for services and products. As a client, I
want to search for services and products.
|
Update search features
|
Simon and Sally
|
4
|
4
|
4
|
3
|
5
|
4
|
2
|
|
...
|
...
|
...
|
...
|
...
|
...
|
...
|
...
|
...
|
|
|
Total (person hours)
|
50
|
48
|
42
|
35
|
30
|
27
|
20
|
||
Based on information in the
iteration backlog, you can plot the effort remaining at the end of each day on
a burndown chart.
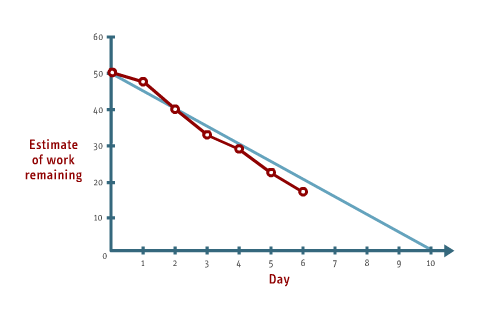
Burndown chart
In this chart, you plotted the
estimates of effort remaining at the end of each day in the iteration so that
the team could view its progress. The idealized line illustrates the desired
level of progress, if the team is to complete the iteration successfully. In
this case, the team's progress is ahead of schedule, so by day 10 of the
iteration the effort remaining should be zero.
Hiç yorum yok:
Yorum Gönder